
Testing Your WIFI Connection
Setup and Configuration
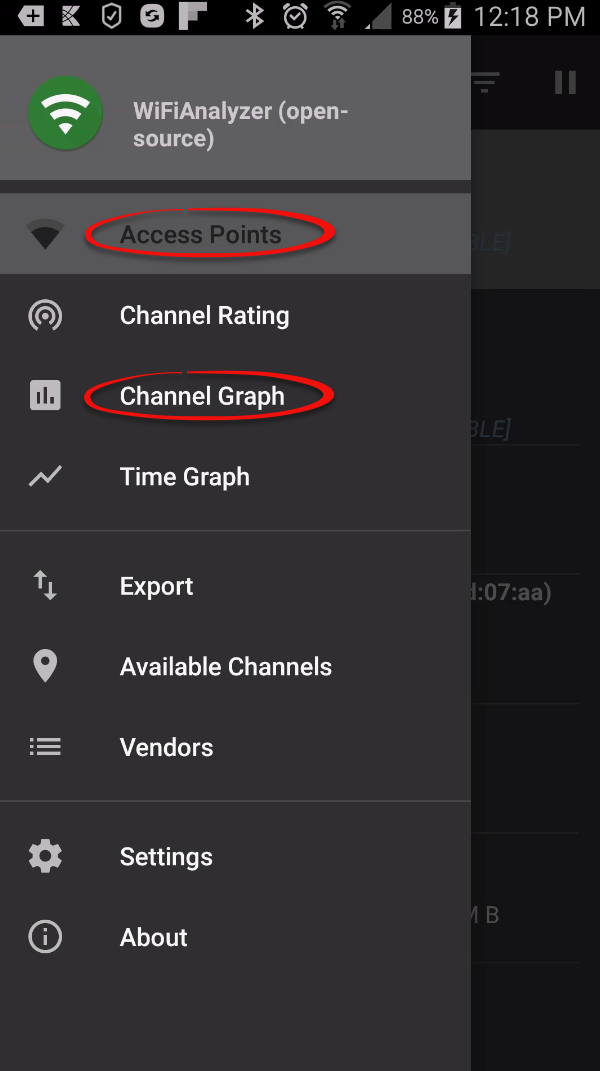
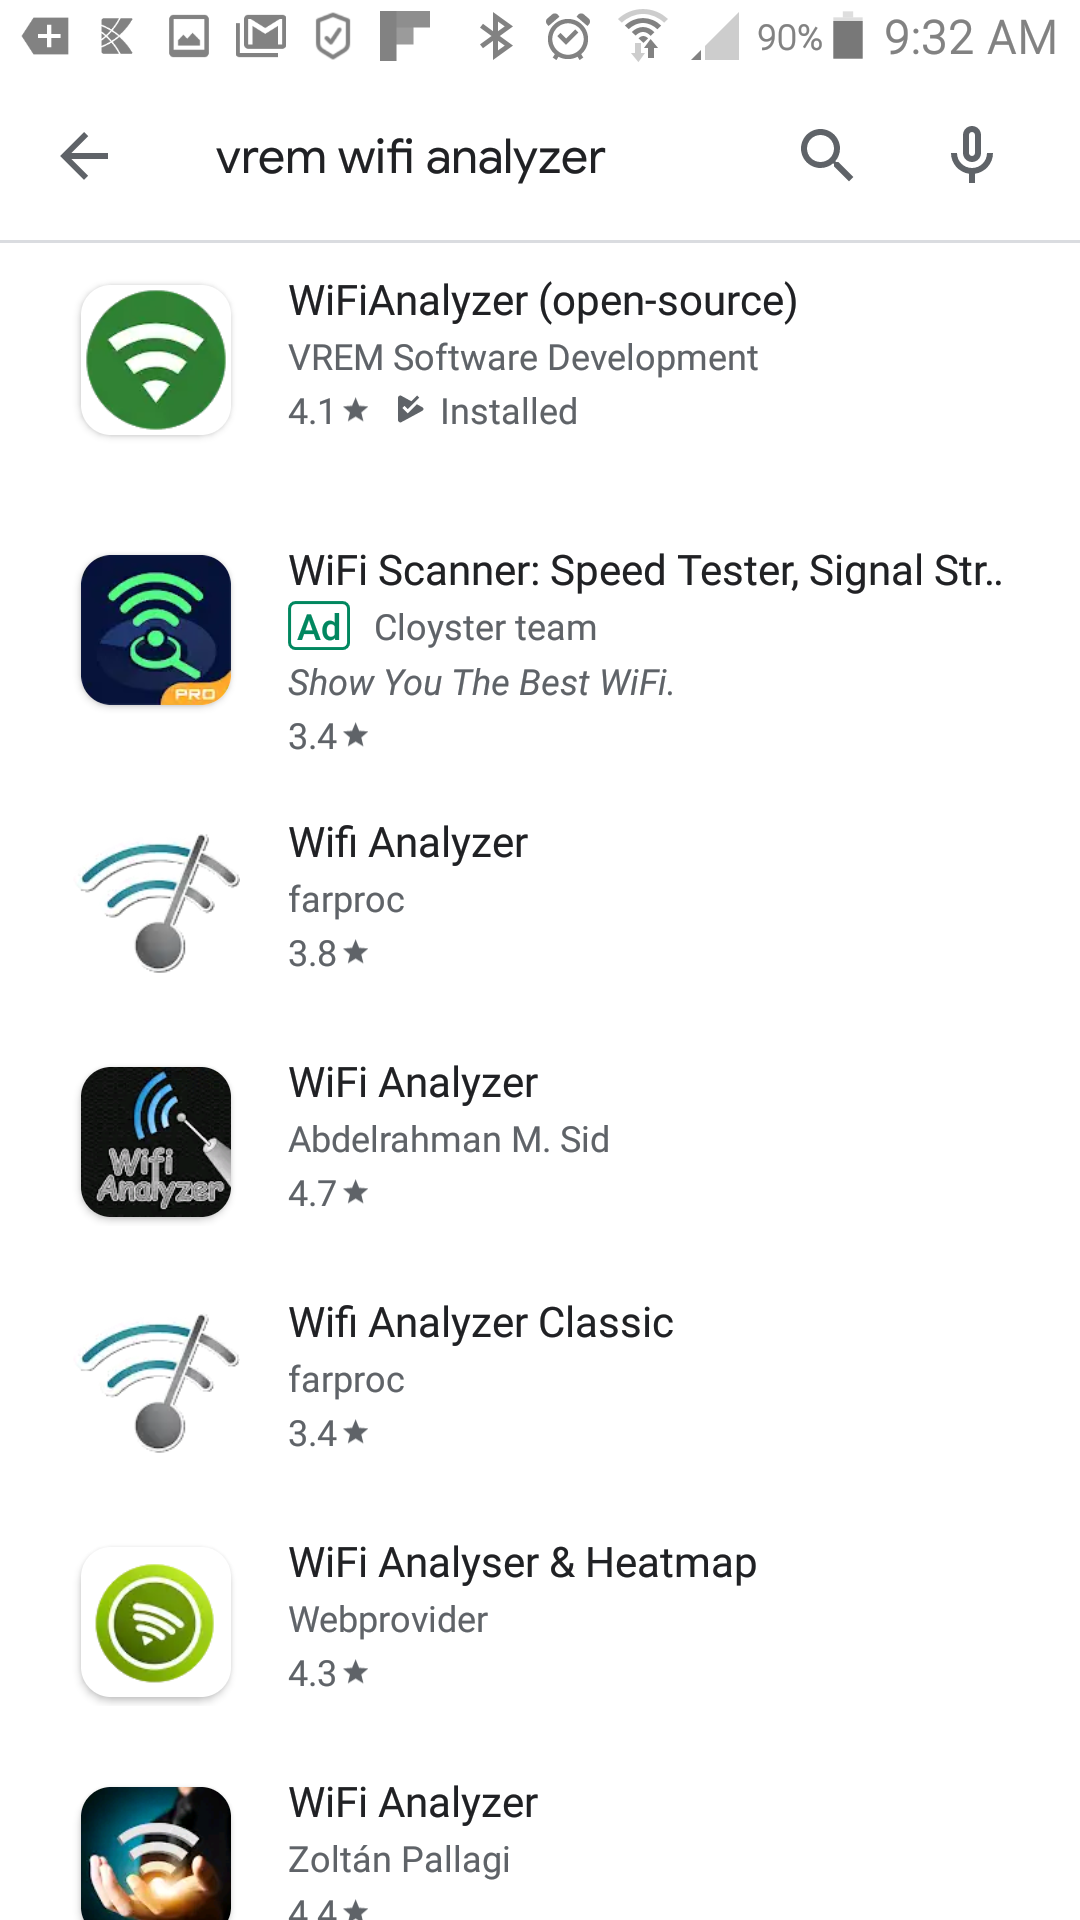
To accurately test your network connection, you must install a specific third-party diagnostic application on your Android handheld device.
User Side (Enforcement Staff):
-
Open
DownloadPlay Store on your Android handheld device.
Search for and download WifiAnalyzer (OpenSource) by VREM Software Group. This is a WIFIfree Analyzerutility Applicationapplication.
Using this Feature
This app could be installed on a cell phoneAdministrators and itstaff allowscan youuse this application to take a measureprecise measurement of wifitheir Wi-Fi strength and source as far as channel.The app we recommend is a product ofidentify the companysource VREMchannel.
-
andOpen
is calledthe WifiAnalyzer(OpenSource).It's a free downloadapplication ontheyourGoogle Playstore.
device.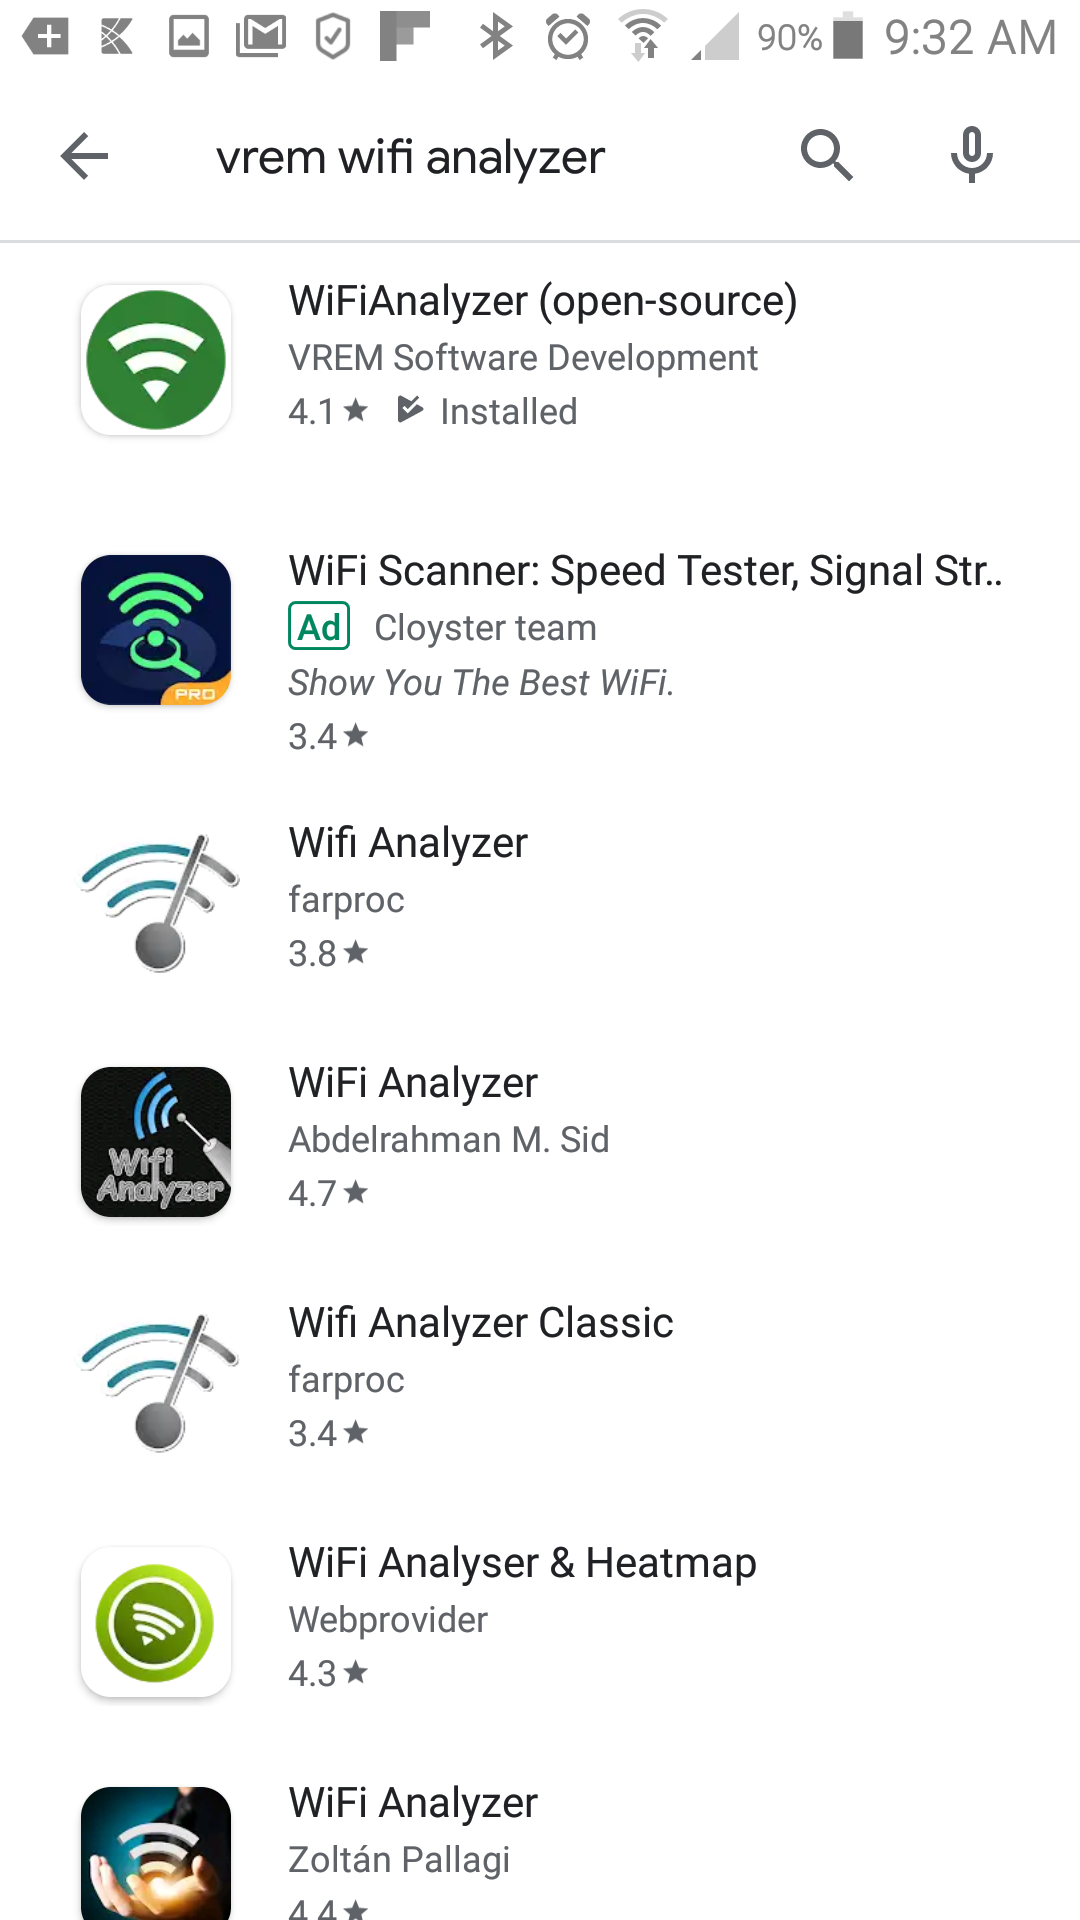
-
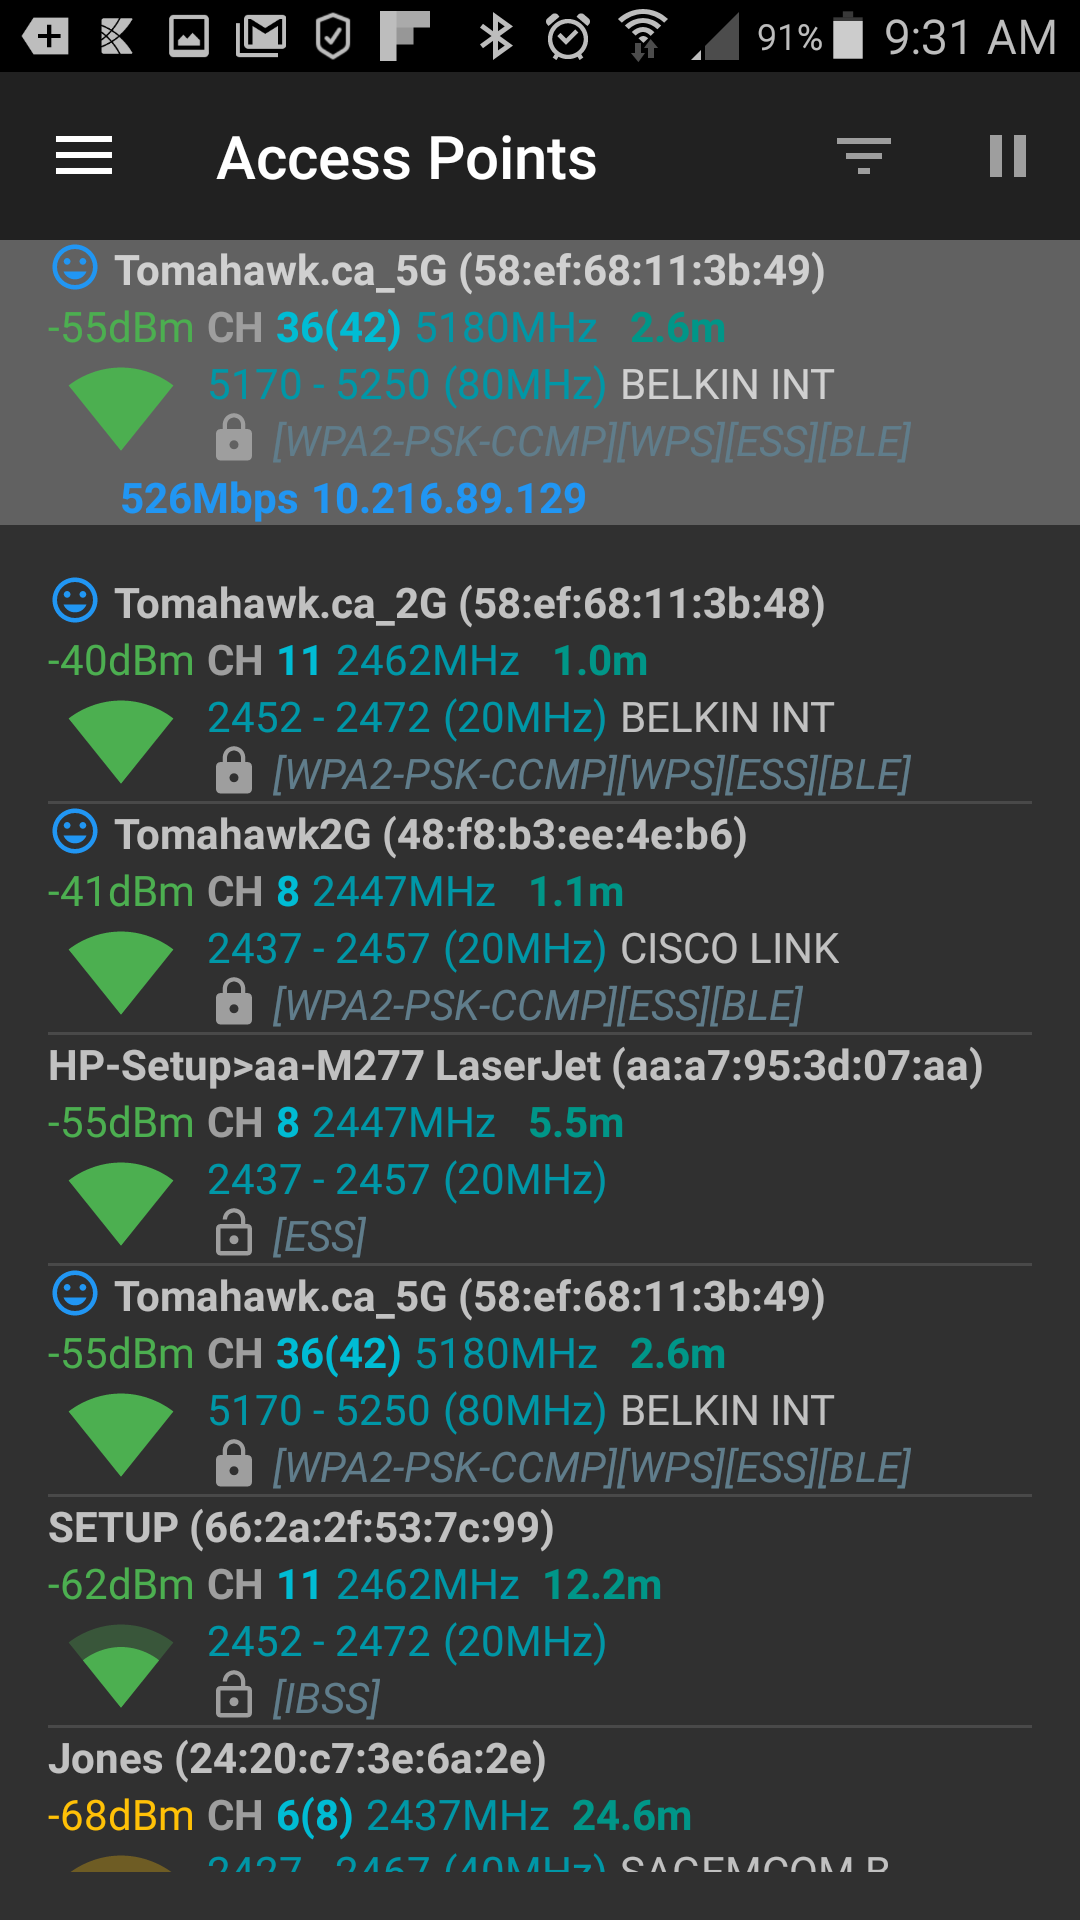
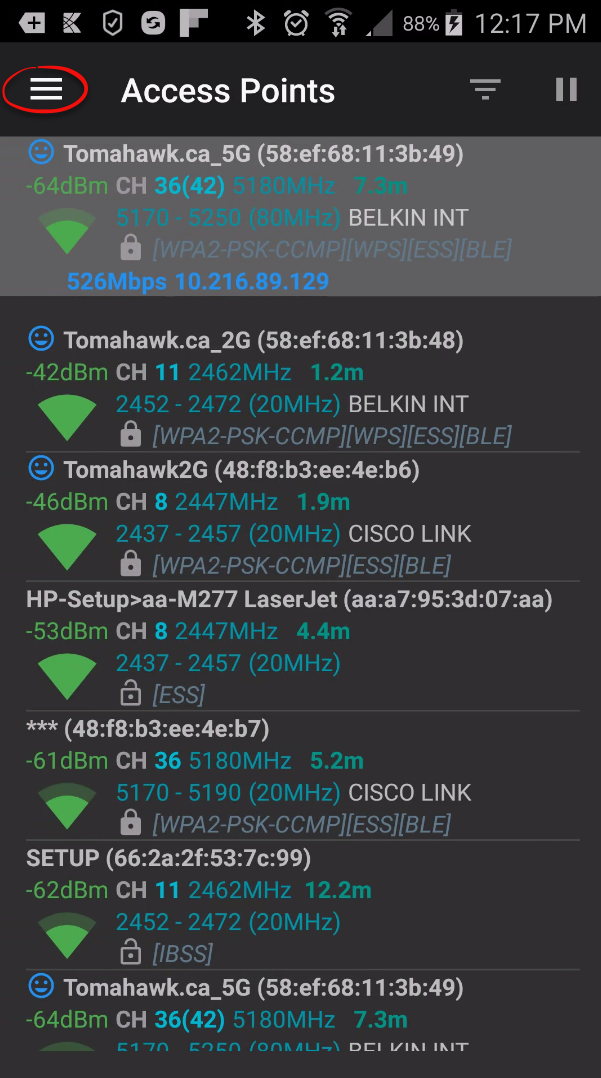
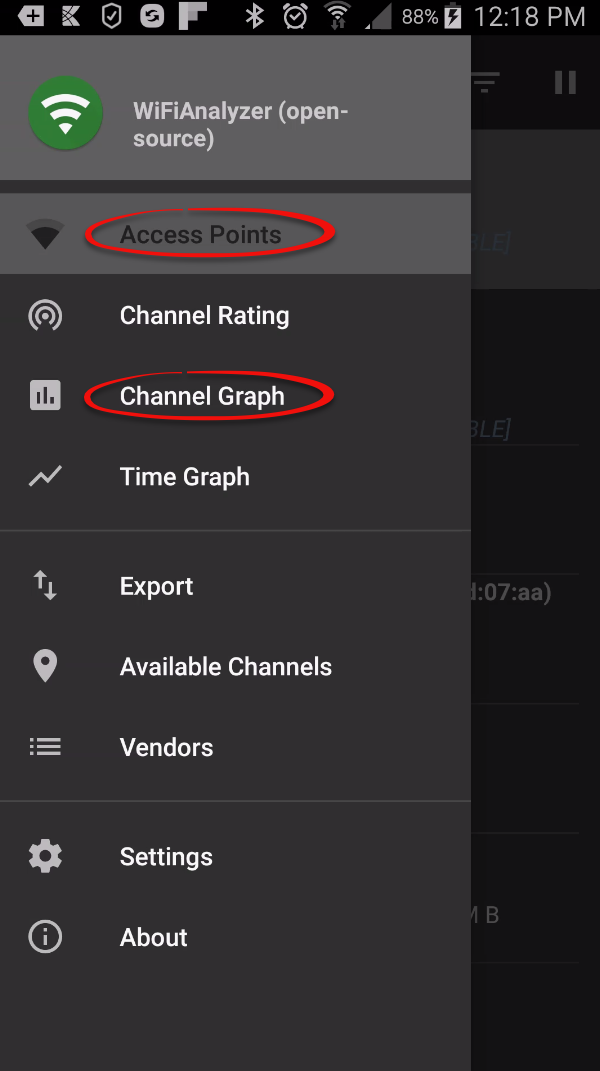
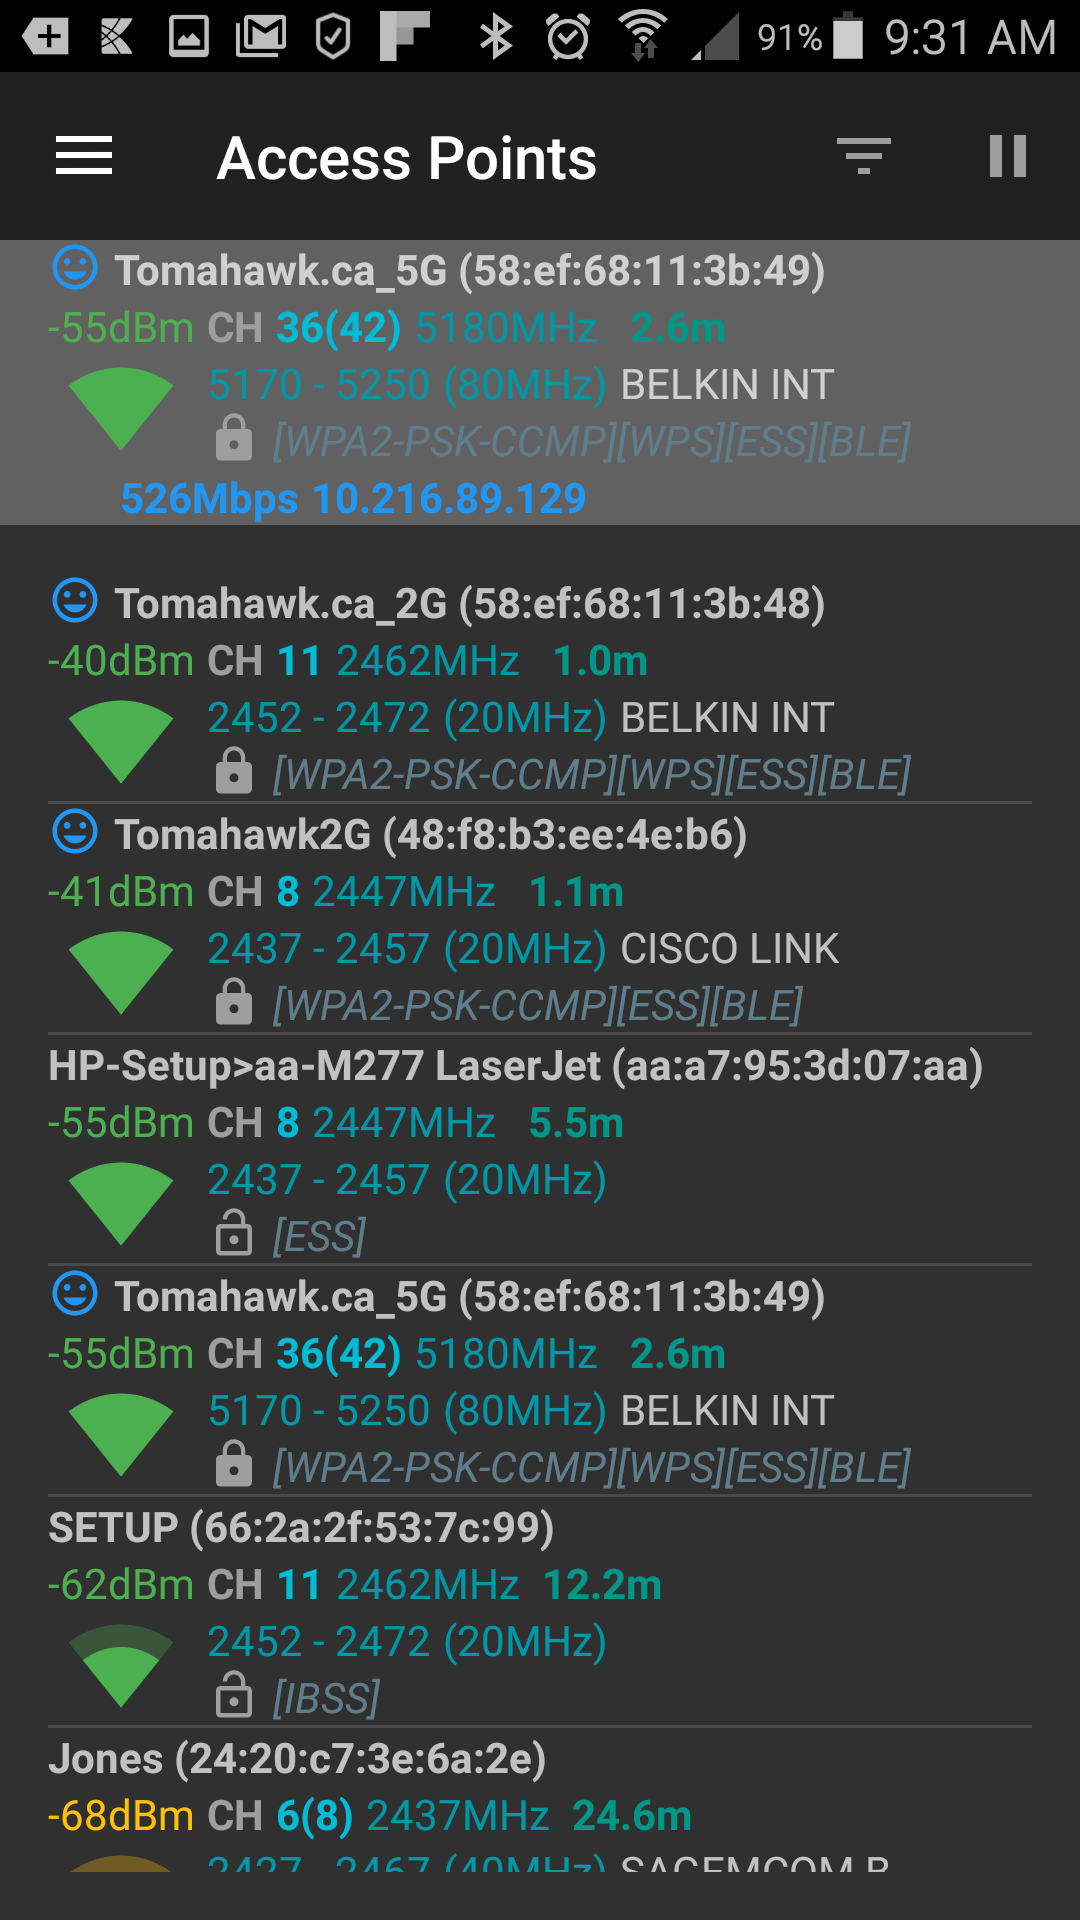
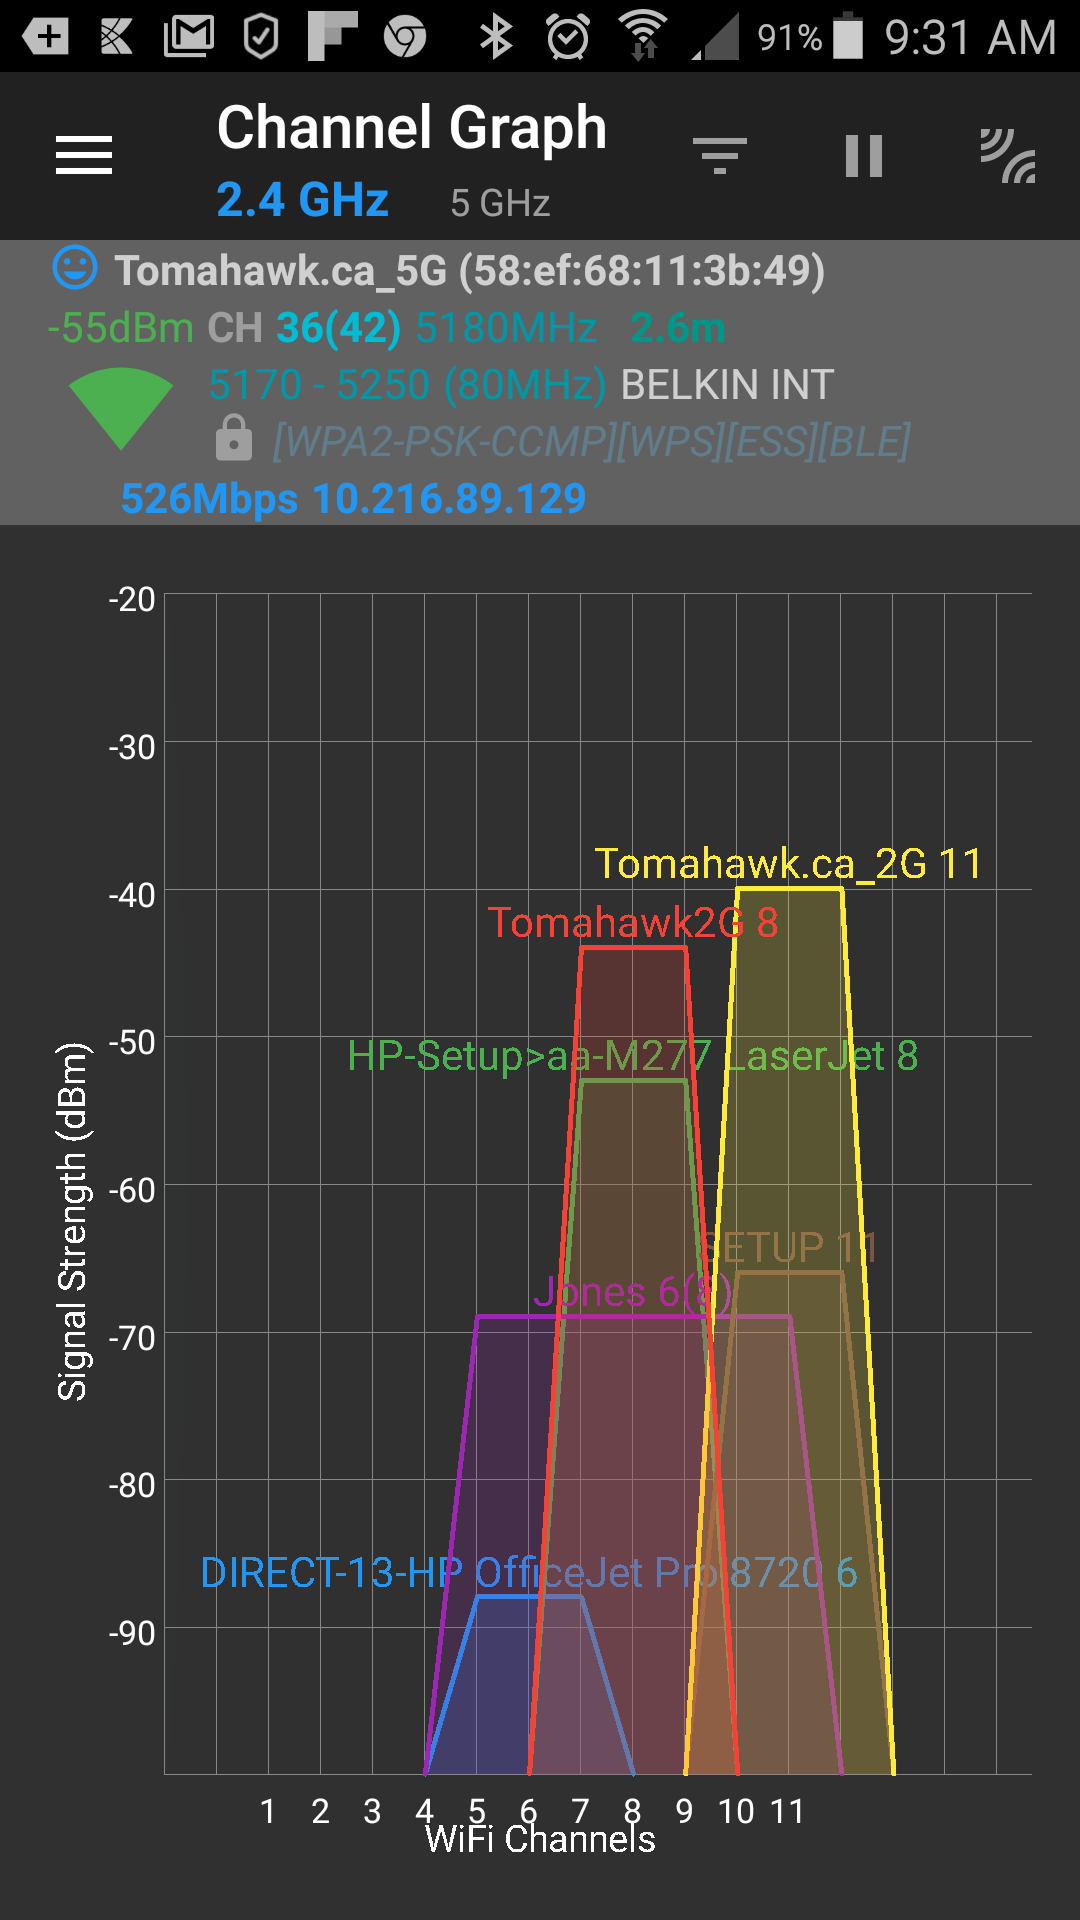
This app will give you a graphic representation ofTap thesignalmenustrength. There are two screens we are interested in. One is Access Points and the other is Channel Graph. Both are available from the hamburger Iconicon (three parallel lines) located at the top left of theapp.screen
to open the main menu.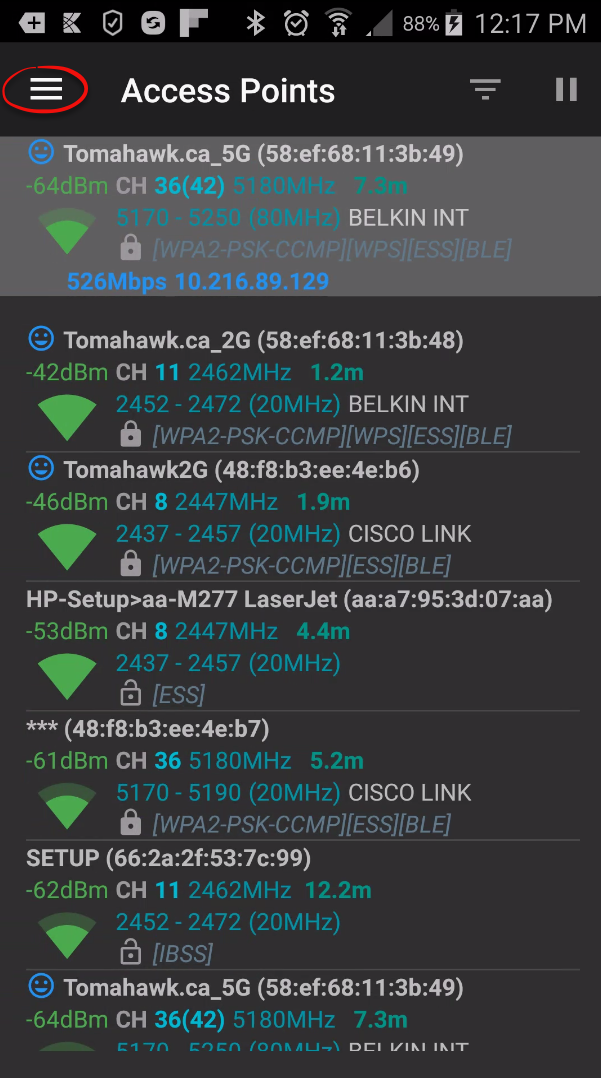
-
The Menu Items We Are Interested In: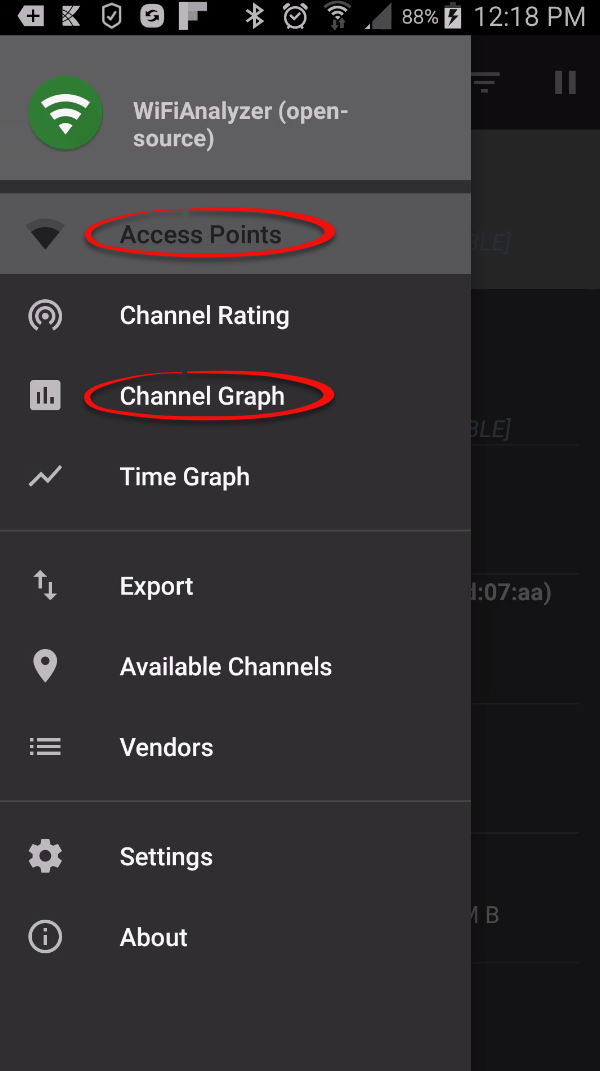
to view a detailed list of available networks and their current signal strengths.TheTap Access PointsScreen -
TheTap Channel GraphScreen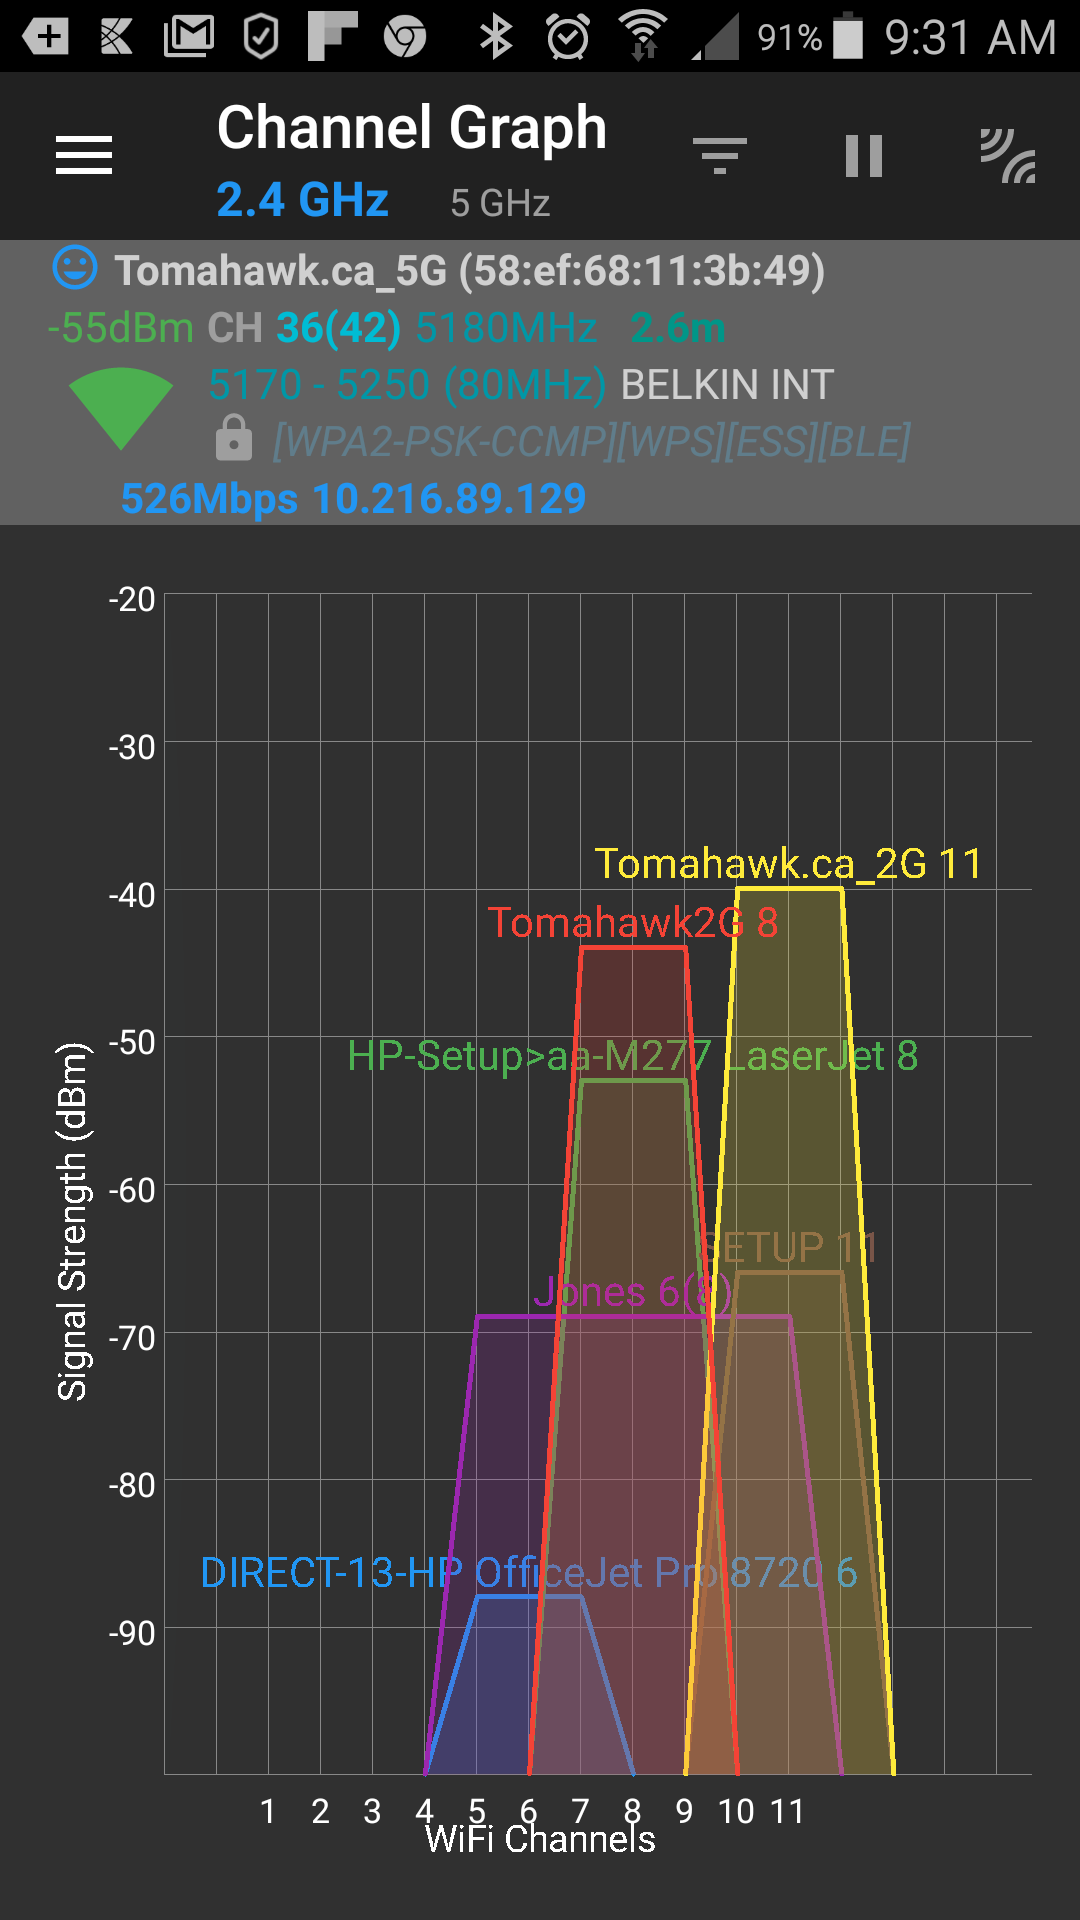
Help with Troubleshooting WIFIThis is something that would be greattolookviewatathroughoutvisualtherepresentationdayof channel congestion andespeciallyoverlappingwhennetworkyousignals.have
Visual in signal. What we are looking for is how much it goes upCues and downStatus throughIndicators
-
Signal Strength Graph: The signal strength is
shownvisually represented as acolourcolor risingupfrom the bottom of thegraphgraph,thattypicallyrangesranging fromminus-100100dbdBm tominus-2020db.dBm. -
TheReadingsmallerdBm Values: Correction note: Signal strength is measured in negative decibel-milliwatts (dBm). Because these are negative numbers, a value closer to zero (e.g., -20 dBm) indicates a much stronger and better signal, whereas a lower number (e.g., -100 dBm) indicates a very weak signal.
Best Practices and Considerations
-
Monitor throughout the
numberday: It is highly recommended to monitor thehigherconnection periodically throughout the day. Wi-Fi environments fluctuate, and observing how much the signal(keepgoesinupmindandthatdownthesecannumbershelparepinpointnegativeexactlysowhen-100andiswhymuchconnectivitybetterdropsthan -20)occur.To -
TheChecksecondchannelthingcongestion:wePayarecloselookingattentionfor isto how many devices or networks are broadcasting on the exact same channel.Too many devices trying to access
onthe same channel simultaneously will create interference and haveana severe adverseaffecteffect on your connectivity strength. -
Capture data for support: Please provide screen captures of
thesebothitemsthe Access Points and Channel Graph screens when contacting support. Having a visual record of the exact dBm reading for your Wi-Fi source and the channel congestion allows the OPS-COM support team to assist you much more effectively.