
Using the OPSCOM-ARC System Dashboard & Widgets
The OperationsCommanderSystem (OPSCOM)dashboardDashboard is a fully customizable, widget-based analytics dashboardinterface built directly into the adminadministrative portal. EachIts userprimary canpurpose is to allow administrators to visualize organizational data, track key operational metrics, and create multiplepersonalized personalreporting dashboards,views arrange widgets freely onusing a drag-and-drop grid,grid. This article is intended for OPS-COM administrators responsible for monitoring system analytics and managing operational data.
Setup and Configuration
This feature is a core administrative tool used to display graphical and tabular representations of your operational data.
Admin Side: Administrators must have the appropriate system role permissions enabled to view, edit, or set default dashboards. Access to specific data within the widgets is automatically restricted based on the administrator's existing system permissions.
Using this Feature
Administrators can use the following instructions to create custom dashboards, manage layouts, and configure each widget individually to show exactly theindividual data theywidgets.
There are fully responsive down to mobile widths.
Dashboard Types
OPSCOM has two distinct dashboard types. The type is determined by where the dashboard is accessed from, and controls which widgets and data sources are available.
General Dashboard
The General Dashboard is the main operations dashboard, accessible to all admin users when they first log in and can be returned to at any time from anywhere in the system by clicking on the OPSCOMOPS-COM Logologo, in the top-left corner. It surfacessurfacing organization-wide datadata. andThe is designed to give a broad operational overview.
Available widgets: Graph, Filterable Graph, List, Map, WYSIWYG, Incident AssociationDefault data sources: All sources tagged general (Violation Stats, LPR Stats, Permit Stats)
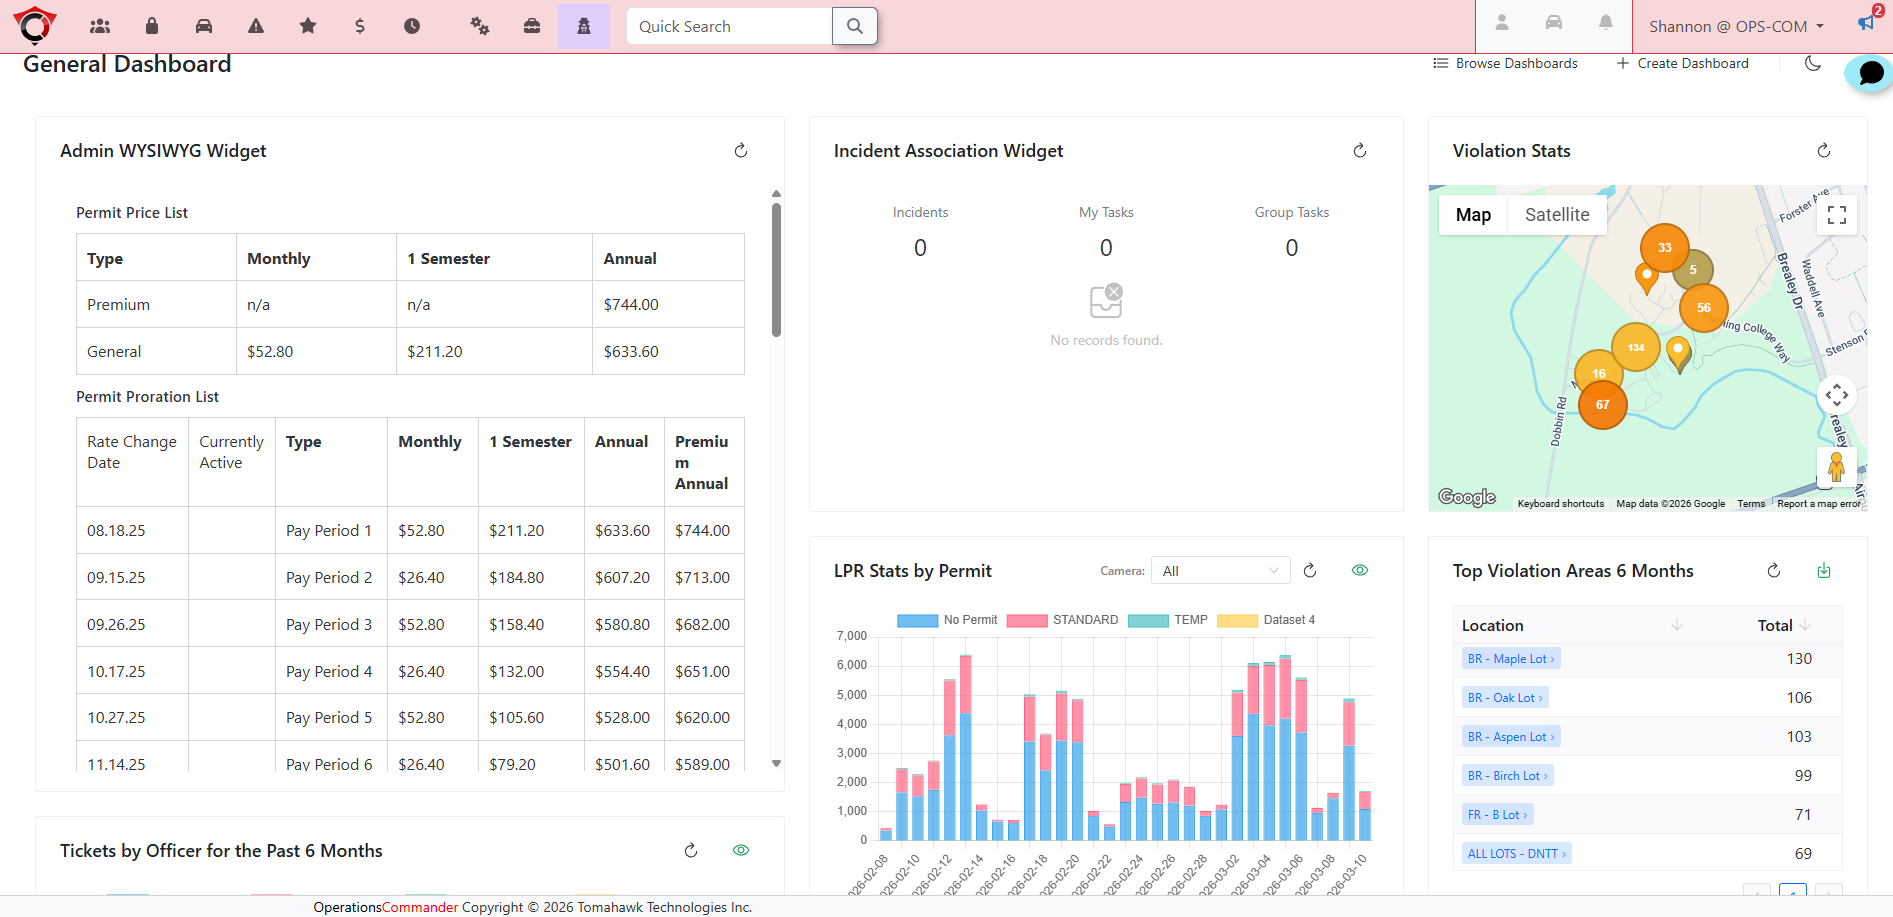
Admin Dashboard
The Admin Dashboard is a per-admin profile dashboard, shown when viewing a specific admin's profile page.page Itand isautomatically scopedfilters data to that adminspecific — widgets that show violation or activity data are automatically filtered to the admin being viewed, not the person viewing the page.user.
Available widgets: Graph, Filterable Graph, List, Map, WYSIWYG, Admin Info, Incident AssociationDefault data sources: Violation Stats + all sources tagged admin (LPR Stats)
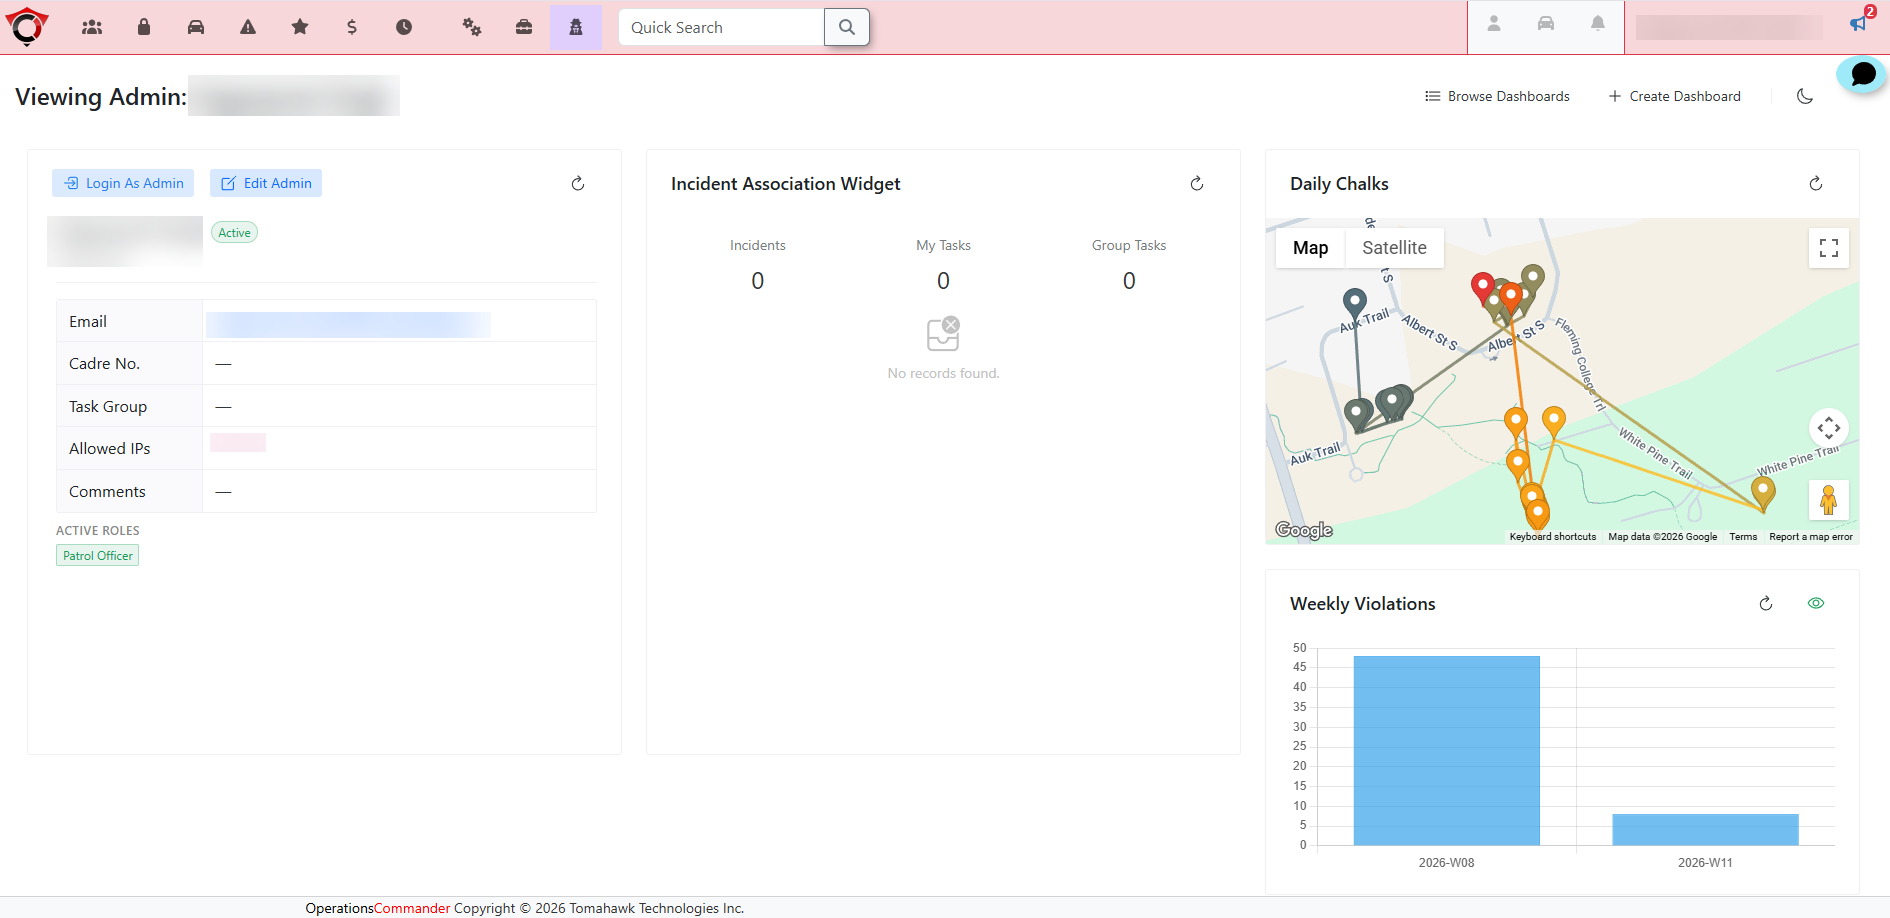
Managing Dashboards
Creating a Dashboard
-
OnClick theDashboardhomepage in the admin portal, click+ Create Dashboard.button on the Dashboard homepage. -
Enter a descriptive title in the
NameNameand choose aVisibility:field. -
Select Private
it)–(only you can seeit.or Visible
–(any admin withthebrowsedashboard_browsepermissionpermissions canbrowseviewit.it) from the visibility options.-
Click the Create
.Thebutton to immediately open the newdashboard opens immediately.workspace.
Switching Between Dashboards
Open the dashboard picker drawer named Browse Dashboard at any time. All dashboards you own, collaborate on, or that are "Visible" are listed. Click any entry to switch. Your personal default and the organization default are highlighted.
Editing a Dashboard Layout
-
Toggle the Edit Mode
viaswitch located in thetoolbar toggle switch. In edit mode you can:toolbar. -
Drag widgets by their header to reposition them on the grid.
-
ResizeDragwidgets by dragging theirthe bottom-rightcorner.corner of any widget to resize it. -
Addwidgets usingClick the+SaveAdd Widgetbutton (opens the widget gallery). Delete or duplicateindividual widgets via the icons that appear on each widget header.Rename or change visibilityof the dashboard via theEditLayout button in thetoolbar.Awidget type— determines how data is rendered.Adata source— determines where the data comes from and what filters are available.Aconfiguration— display settings, filters, and widget-type-specific options.
When finished, click Save Layouttoolbar to persist the grid positions.
Sharing & Collaboration
|
|
|---|---|
|
|
|
|
|
|
|
|
Deleting a Dashboard
Open the dashboard picker, hover over the dashboard entry, and click the trash icon.
Please Note: Deletion is permanent.
Widgets
Widgets are the individual panels that populate a dashboard. Each widget has:
Adding aand WidgetConfiguring Widgets
-
TurnToggleonthe Edit Mode.switch in the toolbar. -
Click the + Add Widget
.button - to
Browse or searchopen the widget gallery.Each card shows the widget type and compatible data sources. -
Click a specific widget card to add
it.itThetowidget appears on theyour grid. -
Click the
⚙️Settings icon on the new widget header tochooseopenathedataconfigurationsourcemodal. -
Select the appropriate metrics from the Data Source drop-down menu.
-
Configure the specific Display Settings and
configureFilterit.Settings for your required view. -
Click the Save button to apply the configuration and fetch the data.
Available Widget Types
| Widget Type | Description | ||||||||||||
| Graph | Displays data as an interactive chart. Supports
|
||||||||||||
| List | Displays data as a sortable, paginated data |
||||||||||||
| Map | Displays geocoded records as pins on an interactive clustering, color-coding by
|
||||||||||||
| Admin Info | A read-only profile summary card |
||||||||||||
| Incident Association | Displays incident association data relevant to the specific dashboard context. |
Available the deployment.
Data Sources
| Data |
Compatible |
Common |
||||||||||||||||||||||||||||||||||||||||||||||||||||||||||||||||||||||||||||||||||||||||||||||||||||||||||||||||||||||||||||||||||||||||||||||||||||||||
| Violation Stats |
|
|
|
| ||
|---|---|---|---|---|
|
Filter
|
|
||
| Permit Stats |
Graph, List | Filter by active only status, permit type, specific lots, or lot zones. Group by | type, lot,
|
|
| LPR
|
|
| ||
|
|
| ||
|
|
| ||
|
|
| ||
|
|
| ||
|
|
|
Filter Settings
|
|
|
|---|---|---|
|
|
|
|
|
|
|
|
|
|
|
|
Permit Stats
Identifier: permit-statsCompatible widgets: Graph, List
Display Settings
|
|
|
|---|---|---|
|
|
|
|
|
|
|
|
|
|
|
|
|
|
|
|
|
|
|
|
|
Filter Settings
|
|
|
|---|---|---|
|
|
|
|
|
|
|
|
|
|
|
|
|
|
|
LPR Stats
Identifier: lpr-statsCompatible widgets: Graph, Filterable Graph, List, Map
Display Settings
|
|
|
|---|---|---|
|
|
|
|
|
|
| type or
|
|
|
|
|
|
|
|
|
|
|
|
|
|
|
|
| entry/exit
|
|
|
Dashboard
Filter Settings
| Permission | Operational Effect | |
|
|
|
|---|---|---|
|
Allows
|
|
|
|
|
Map-only Settings (Geo Display)
|
|
|---|---|
|
|
|
|
|
|
|
|
|
|
|
|
Widget Settings Modal
Every widget has a ⚙️ Settings button (visible in both view and edit modes). The modal contains:
Widget Name— optional custom title shown in the widget header. Defaultsadministrator tothe data source name if left blank.Data Source— dropdown to choose which data source powers this widget. Only sources compatible with the current widget type are shown.Widget-type settings— e.g. Chart Type and Colorful Bars (Graph widgets).Display Settings tab— grouping, columns, sort, measure, entity filter settings.Filters tab— record-level filters (time period, payment status, lot restrictions, etc.).
Click Save to apply. The widget immediately re-fetches data with the new configuration.
Permissions Reference
|
|
|---|---|
|
|
|
|
dashboard_set_org_default |
Allows
|
|
|
|
|
Tips & Best Practices and Considerations
-
UseUtilize the Filterable Graph for LPR Cameradatadata:—Setsetthe Filter Dimension to Camera to get a per-cameradropdowndrop-down directly on thewidgetwidget. This allows you to quickly filter views withoutopeningneeding to open the backend widget settings. -
Star your most-used
dashboarddashboard:soMark your primary dashboard as your personal default. Clicking the star icon ensures it loads automatically as your landing page when you navigate to thedashboard page.portal. -
Use effective graph combinations: Use the Group by Entity
+setting combined with a Stacked Bar chart. This is the most readable combination for comparing multiple cameras, lots, or writers side by side. -
Create annual progress charts: Combine the Year to Date
+time period with the Group by Month setting.givesThis creates acleanclean, automated year-progress chart that resets automatically each January. -
Optimize Map widgets: Configure Geo widgets
work best4–4 to 8 Hours time range and enable the Cluster Pinsenabledsetting. This prevents map clutter and improves performance for busy patrol routes. -
TheCombine List and Graph widgets: Place a List widgetis idealalongside a Graph widget on the same dashboard— useusing the exact same data source and filtersettingssettings.toThisgiveprovides administrators with both a high-level visual chartviewand a raw-record drill-down ontheasamesingle screen.