
Using the OPSCOM-ARC System Dashboard & Widgets
The OperationsCommander (OPSCOM)dashboard is a fully customizable, widget-based analytics dashboard built into the admin portal. Each user can create multiple personal dashboards, arrange widgets freely on a drag-and-drop grid, and configure each widget individually to show exactly the data they need. Dashboards and widgets automatically refresh on a configurable schedule and are fully responsive down to mobile widths.
Dashboard Types
OPSCOM has two distinct dashboard types. The type is determined by where the dashboard is accessed from, and controls which widgets and data sources are available.
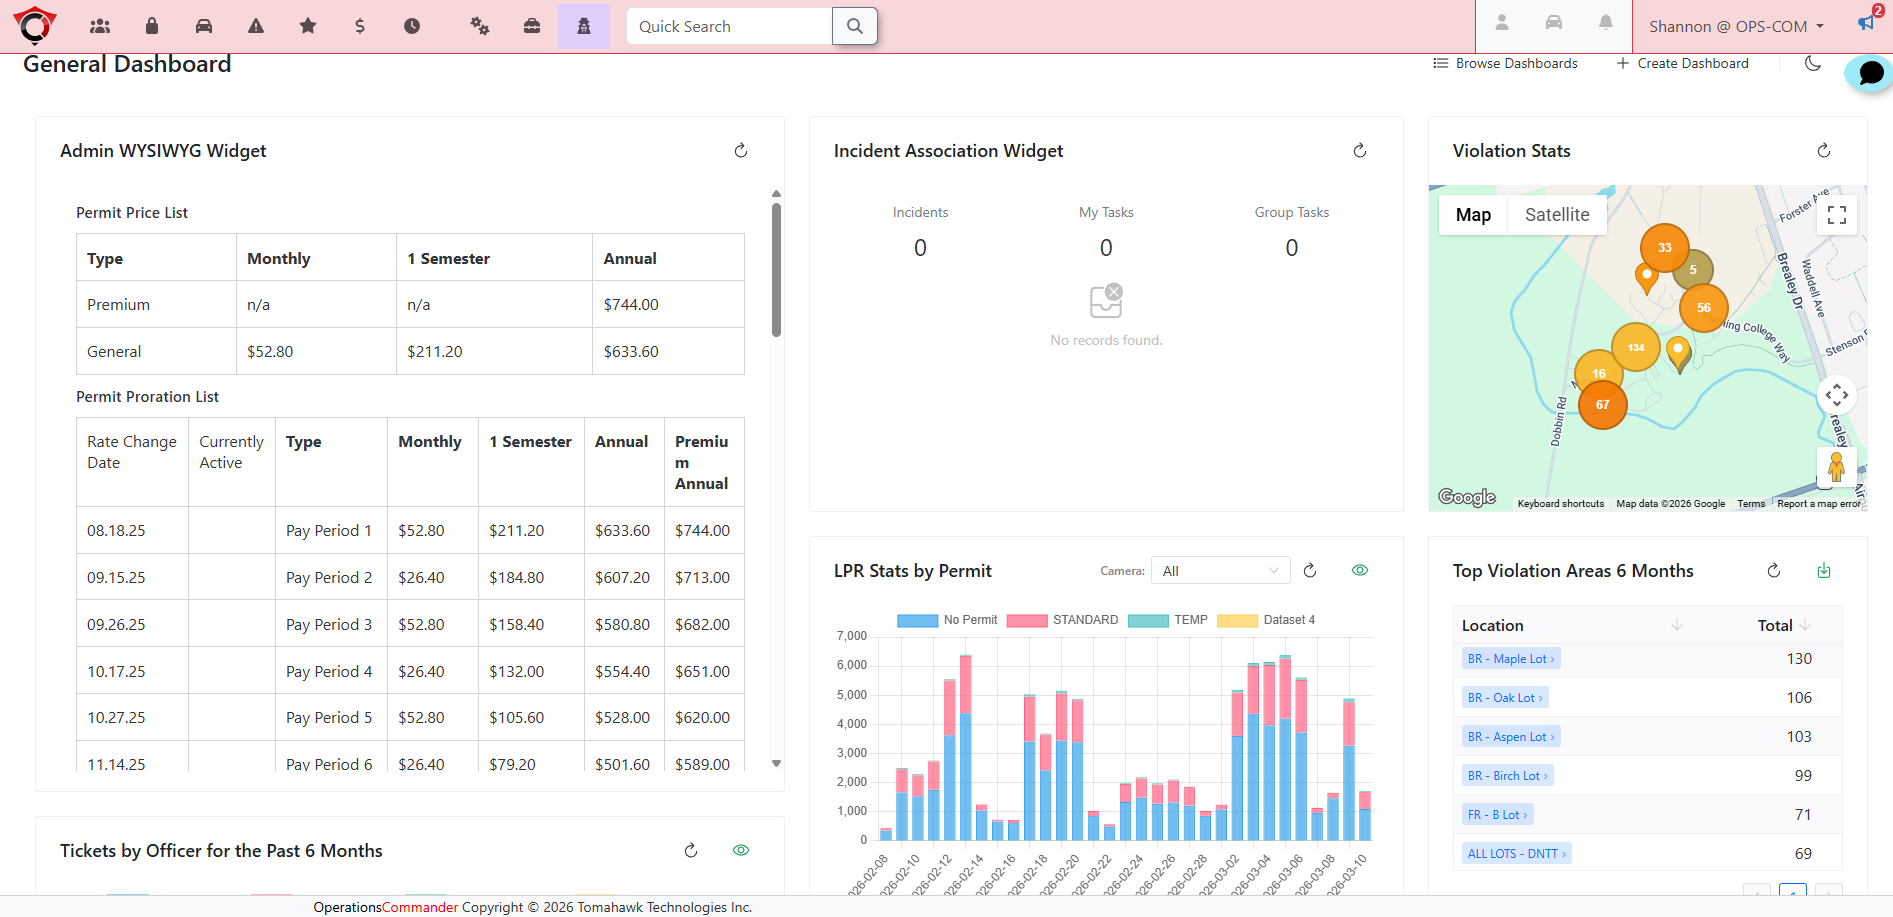
General Dashboard
The General Dashboard is the main operations dashboard, accessible to all admin users when they first log in and can be returned to at any time from anywhere in the system by clicking on the OPSCOM Logo in the top-left corner. It surfaces organization-wide data and is designed to give a broad operational overview.
Available widgets: Graph, Filterable Graph, List, Map, WYSIWYG, Incident Association
Default data sources: All sources tagged general (Violation Stats, LPR Stats, Permit Stats)
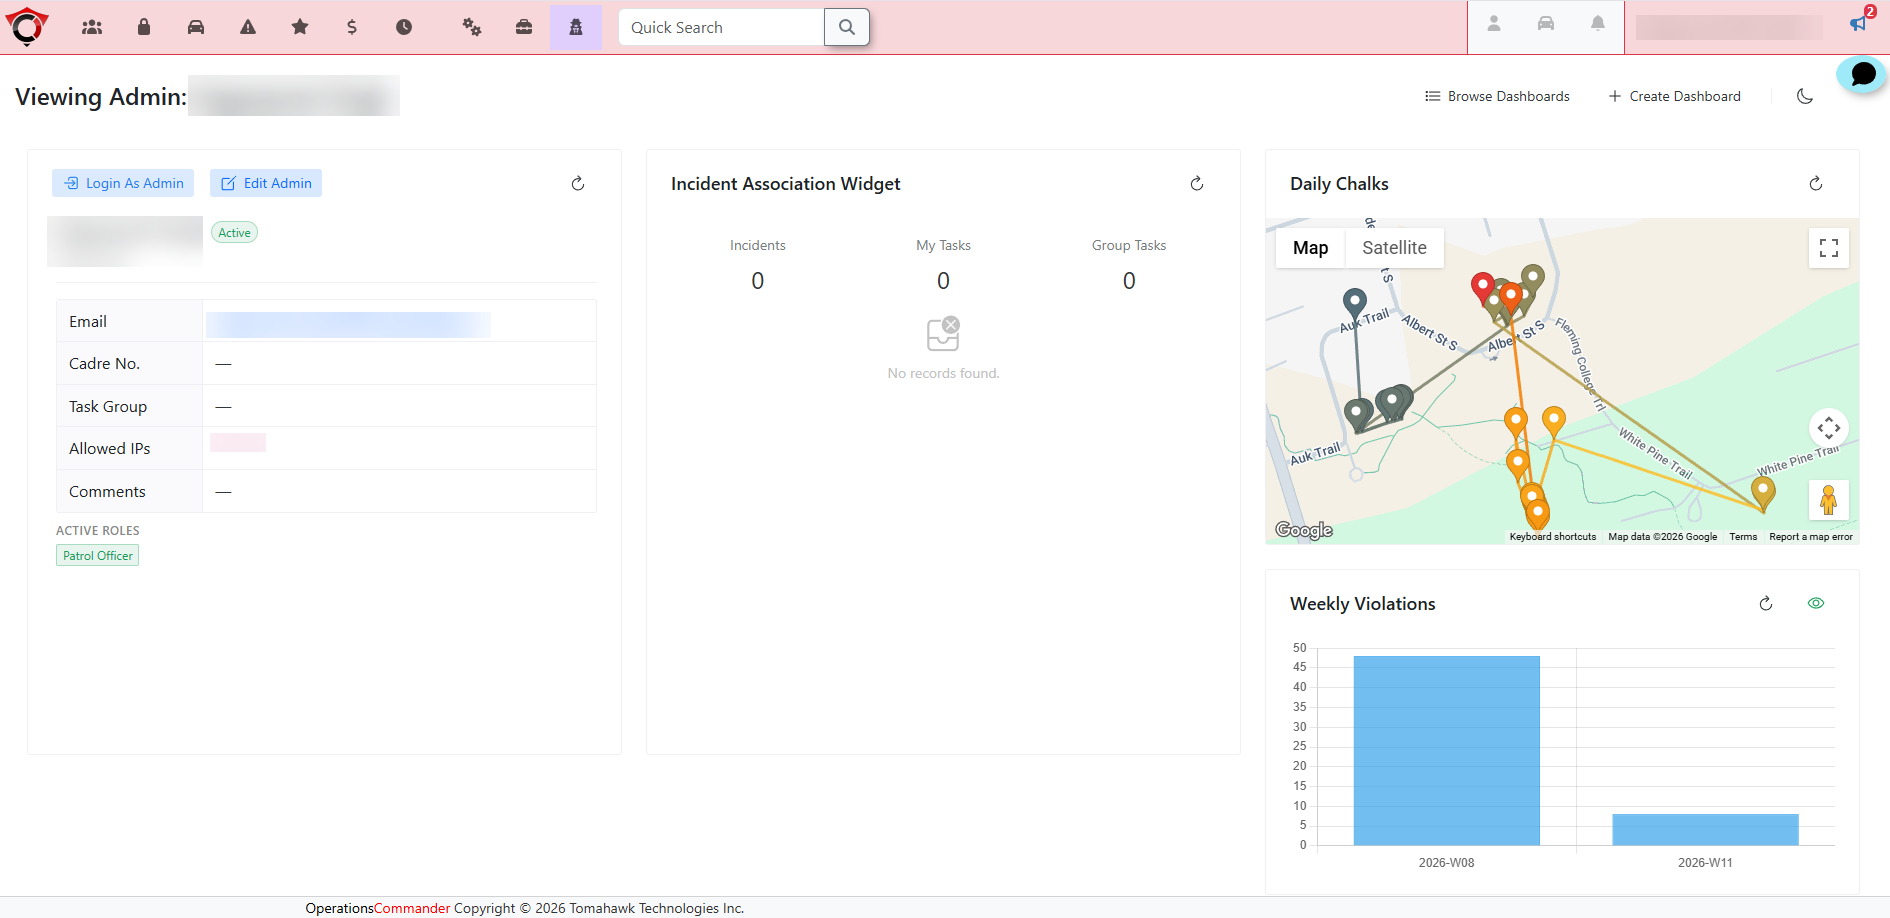
Admin Dashboard
The Admin Dashboard is a per-admin profile dashboard, shown when viewing a specific admin's profile page. It is scoped to that admin — widgets that show violation or activity data are automatically filtered to the admin being viewed, not the person viewing the page.
Available widgets: Graph, Filterable Graph, List, Map, WYSIWYG, Admin Info, Incident Association
Default data sources: Violation Stats + all sources tagged admin (LPR Stats)
Managing Dashboards
Creating a Dashboard
-
On the Dashboard homepage in the admin portal, click + Create Dashboard.
-
Enter a Name and choose a Visibility:
-
Private – only you can see it.
-
Visible – any admin with the dashboard_browse permission can browse it.
-
-
Click Create. The new dashboard opens immediately.
Switching Between Dashboards
Open the dashboard picker drawer named Browse Dashboard at any time. All dashboards you own, collaborate on, or that are "Visible" are listed. Click any entry to switch. Your personal default and the organization default are highlighted.
Editing a Dashboard
Toggle Edit Mode via the toolbar toggle switch. In edit mode you can:
-
Drag widgets to reposition them on the grid.
-
Resize widgets by dragging their bottom-right corner.
-
Add widgets using the + Add Widget button (opens the widget gallery).
-
Delete or duplicate individual widgets via the icons that appear on each widget header.
-
Rename or change visibility of the dashboard via the Edit button in the toolbar.
When finished, click Save Layout to persist the grid positions.
Sharing & Collaboration
|
Feature |
How to use |
|---|---|
|
Collaborators |
Add other admins as collaborators (Edit button → Collaborators tab). Collaborators can view and edit the dashboard. |
|
Visibility |
Set to Visible to allow anyone with dashboard_browse permission to view it (read-only). |
|
Organization Default |
Admins with dashboard_set_org_default permission can mark one dashboard as the org default — it appears as the landing dashboard for all admins. |
|
Personal Default |
Each user can star ⭐ a dashboard to mark it as their personal landing page. |
Deleting a Dashboard
Open the dashboard picker, hover over the dashboard entry, and click the trash icon.
Please Note: Deletion is permanent.
Widgets
Widgets are the individual panels that populate a dashboard. Each widget has:
-
A widget type — determines how data is rendered.
-
A data source — determines where the data comes from and what filters are available.
-
A configuration — display settings, filters, and widget-type-specific options.
Adding a Widget
-
Turn on Edit Mode.
-
Click + Add Widget.
-
Browse or search the widget gallery. Each card shows the widget type and compatible data sources.
-
Click a card to add it. The widget appears on the grid.
-
Click the ⚙️ Settings icon on the new widget to choose a data source and configure it.
Widget Types
Graph Widget
Displays data as an interactive chart. Supports five chart styles selectable from the settings modal:
|
Chart Type |
Description |
|---|---|
|
Bar |
Vertical bars — good for comparing counts over time. |
|
Stacked Bar |
Multiple datasets stacked — ideal for group-by breakdowns. |
|
Line |
Trend line — best for continuous time-series. |
|
Pie |
Proportional slices — best for a small number of categories. |
|
Doughnut |
Like Pie but with a hollow centre. |
Extra options:
-
Colorful Bars — when there is only one dataset, each bar gets a distinct colour from the palette.
-
View Data (👁 button) — opens a tabular view of the underlying data with a CSV download option.
Filterable Graph Widget
Identical to the Graph widget with one extra feature: an inline filter dropdown displayed directly on the widget header. This lets users slice the chart in real-time without opening settings.
The available filter dimension (e.g. Camera, Permit Type, Device Type) is configured in the widget settings under Filter Dimension. Once set, the dropdown appears on the widget and fetches the available options automatically from the same data source, respecting all other active filter settings.
List Widget
Displays data as a sortable, paginated data table. The columns shown are controlled by the Columns setting in the data source configuration. Useful for raw record-level views (individual violations, permits, LPR reads).
Map Widget (Geo Location)
Displays geocoded records as pins on an interactive map (Leaflet). Features:
|
Feature |
Description |
|---|---|
|
Cluster Pins |
Groups nearby pins into numbered clusters that expand on zoom. Configurable minimum cluster size and maximum zoom level. |
|
Color by Age |
Pins are coloured from green (recent) to red (older) based on record age. |
|
Draw Path |
Connects sequential records with a polyline — useful for patrol route visualization. |
|
Bounding Box Filter |
Restrict visible records to a lat/long bounding box configured in settings. |
WYSIWYG Widget
A free-form rich-text content panel. Supports formatted text, headings, bullet lists, bold/italic, hyperlinks, and more. Useful for notes, announcements, or instructions embedded directly in the dashboard.
Content is edited in a dedicated editor page (accessible via the widget's settings).
Admin Info Widget
A read-only profile summary card for the admin account currently being viewed. Displays the admin's name, role, contact details, and related account information. This widget is context-aware — it reflects the profile of whichever admin the viewer is currently inspecting, not their own account. No data source configuration required.
Incident Association Widget
Displays incident association data relevant to the dashboard context. Configuration details depend on the deployment.
Data Sources
Data sources connect widgets to the OPSCOM backend APIs. Each data source exposes a set of Display Settings (how data is grouped and presented) and Filter Settings (which records to include). Settings are split across two tabs in the settings modal.
Violation Stats
Identifier: admin-violations
Compatible widgets: Graph, Filterable Graph, List, Map
Display Settings
|
Setting |
Options |
Description |
|---|---|---|
|
Time Period |
All Time / Last 7 Days / Last 30 Days / Last 3 Months / Last 6 Months / Year to Date / Last Year |
Limits records to a relative date window. |
|
Group by Time |
None / Day / Week / Month / Year |
Buckets records by time period on the X-axis. |
|
Group by Entity |
None / Plate / Location / Writer / Category |
Splits data into one dataset per entity value. |
|
Entity Limit |
Auto / Manual |
Auto = top N entities; Manual = pick specific values. |
|
Entity Filter |
Multi-select (up to 10) |
Visible when Group by Entity + Manual limit is set. |
|
Measure |
Count / Revenue |
Whether Y-axis shows number of violations or dollar revenue. |
|
Columns (List only) |
Ticket, Issued, Fine, Towing, Adjusted Fine, Due Date, Warning, Spoiled, Collections, Plate, Location, Writer, Category, Lat, Long, Revenue, Count |
Columns to include in the list table. |
|
Sort Order |
Ascending / Descending |
|
Filter Settings
|
Setting |
Options |
Description |
|---|---|---|
|
Payment Status |
Unpaid / Overdue / Paid / Collections (multi-select) |
Filter by payment state. |
|
Payable Only |
Toggle |
Show only violations that are currently payable. |
|
Geocoded Only |
Toggle |
Show only violations with GPS coordinates (useful for Map widget). |
|
Active Writer Only |
Toggle (default: on) |
Exclude records from deactivated admin accounts. |
Permit Stats
Identifier: permit-stats
Compatible widgets: Graph, List
Display Settings
|
Setting |
Options |
Description |
|---|---|---|
|
Time Period |
All Time / Last 7 Days / Last 30 Days / Last 3 Months / Last 6 Months / Year to Date / Last Year |
Date window filter on permit submit date. |
|
Group by (Graph only) |
None / Permit Type / Lot / User Type / Lot Group / Lot Zone |
Splits into one dataset per group value. |
|
Entity Limit (Graph only) |
Auto / Manual |
Auto = top N; Manual = pick specific values. |
|
Entity Filter |
Multi-select (up to 10) |
Shown when Manual limit is active. |
|
Measure |
Count / Revenue |
Count of permits vs. revenue generated. |
|
Columns (List only) |
User Type, Lot, Active Start, Active End, Lot Group, Price, Permit Type, Source, Lot Zone |
|
|
Sort Order |
Ascending / Descending |
|
Filter Settings
|
Setting |
Options |
Description |
|---|---|---|
|
Active Only |
Toggle |
Show only currently active permits. |
|
Permit Type |
Standard, Temp, Cale sources (multi-select) |
Filter by permit type/source. |
|
Lots |
Multi-select (all lots) |
Restrict to specific parking lots. |
|
Lot Groups |
Multi-select |
Restrict to one or more lot groups. |
|
Lot Zones |
Multi-select |
Restrict to specific lot zones. |
LPR Stats
Identifier: lpr-stats
Compatible widgets: Graph, Filterable Graph, List, Map
Display Settings
|
Setting |
Options |
Description |
|---|---|---|
|
Time Period (Graph/List) |
All Time / Last 7 Days / Last 30 Days / Last 3 Months / Last 6 Months / YTD / Last Year |
|
|
Time Period (Map only — since_geo) |
Last 4 Hours / Last 8 Hours / Last Day / Last 7 Days |
Short-term windows optimized for real-time map views. |
|
Group by Time |
None / Day / Week / Month / Year |
Time-bucket for X-axis. |
|
Group by Entity |
None / Camera / Permit Type / Device Type / Entry-Exit Type |
|
|
Entity Limit |
Auto / Manual |
|
|
Entity Filter |
Multi-select (up to 10) |
|
|
Filter Dimension (Filterable Graph only) |
Camera / Permit Type / Device Type / Entry-Exit Type |
Sets the inline filter dropdown on the widget face. |
|
Columns (List only) |
Plate, Camera, Permit Type, Recorded, Device Type, Entry/Exit Type |
Visible when Group by Entity is not set. |
|
Sort Order |
Ascending / Descending |
|
Filter Settings
|
Setting |
Options |
Description |
|---|---|---|
|
Permit Type |
All / Temp / Standard / None (multi-value) |
Filter reads by permit validation result. |
|
Camera Type |
Entry / Exit / Monitor / Patrol (multi-select) |
Filter by camera classification. |
Map-only Settings (Geo Display)
|
Setting |
Description |
|---|---|
|
Cluster Pins |
Enable/disable pin clustering. |
|
Cluster Min Size |
Minimum number of pins before they cluster. |
|
Cluster Max Zoom |
Zoom level at which clusters dissolve into individual pins. |
|
Color by Age |
Colour-code pins by record age. |
|
Draw Path |
Connect pins in chronological order with a line. |
|
Bounding Box |
Lat/Long min/max to limit the visible area. |
Widget Settings Modal
Every widget has a ⚙️ Settings button (visible in both view and edit modes). The modal contains:
-
Widget Name — optional custom title shown in the widget header. Defaults to the data source name if left blank.
-
Data Source — dropdown to choose which data source powers this widget. Only sources compatible with the current widget type are shown.
-
Widget-type settings — e.g. Chart Type and Colorful Bars (Graph widgets).
-
Display Settings tab — grouping, columns, sort, measure, entity filter settings.
-
Filters tab — record-level filters (time period, payment status, lot restrictions, etc.).
Click Save to apply. The widget immediately re-fetches data with the new configuration.
Permissions Reference
|
Permission |
Effect |
|---|---|
|
dashboard_browse |
Can view dashboards marked Visible. |
|
dashboard_edit_any |
Can edit any dashboard regardless of ownership. |
|
dashboard_set_org_default |
Can promote a dashboard to org-wide default. |
|
(Owner) |
Full edit rights on own dashboards. |
|
(Collaborator) |
View and edit rights on dashboards shared with them. |
Tips & Best Practices
-
Use the Filterable Graph for LPR Camera data — set Filter Dimension to Camera to get a per-camera dropdown directly on the widget without opening settings.
-
Star your most-used dashboard so it loads automatically when you navigate to the dashboard page.
-
Group by Entity + Stacked Bar is the most readable combination for comparing multiple cameras, lots, or writers side by side.
-
Year to Date + Group by Month gives a clean year-progress chart that resets automatically each January.
-
Geo widgets work best with Last 4–8 Hours time range and Cluster Pins enabled for busy patrol routes.
-
The List widget is ideal alongside a Graph widget on the same dashboard — use the same data source and filter settings to give both a chart view and a raw-record drill-down on the same screen.